Note
Go to the end to download the full example code. or to run this example in your browser via Binder
beach water quality
from tabulight import EDA
from tabulight import wq_data
from tabulight.utils import print_info

# sphinx_gallery_thumbnail_number = 7

print_info()
numpy 2.3.4
pandas 2.3.3
tabulight 0.1.0
python 3.12.10 (main, May  6 2025, 10:49:23) [GCC 11.4.0]
os posix
matplotlib 3.10.7
scipy 1.16.2
seaborn 0.13.2
statsmodels 0.14.5
Script Executed on:  18 October 2025 18:28:05
tot_cpus 2
avail_cpus 2
mem_gib 7.555534362792969
data = wq_data(target=['ecoli', 'sul1_coppml', 'aac_coppml',
                           'tetx_coppml', 'blaTEM_coppml'])
print(data.shape)
(1446, 18)
data.isna().sum()
tide_cm              0
wat_temp_c           0
sal_psu              0
air_temp_c           0
pcp_mm               0
pcp3_mm              0
pcp6_mm              0
pcp12_mm             0
wind_dir_deg         0
wind_speed_mps       0
air_p_hpa            0
mslp_hpa             0
rel_hum              0
ecoli             1279
sul1_coppml       1228
aac_coppml        1228
tetx_coppml       1228
blaTEM_coppml     1228
dtype: int64
eda = EDA(data, save=False)
eda.data_availability()
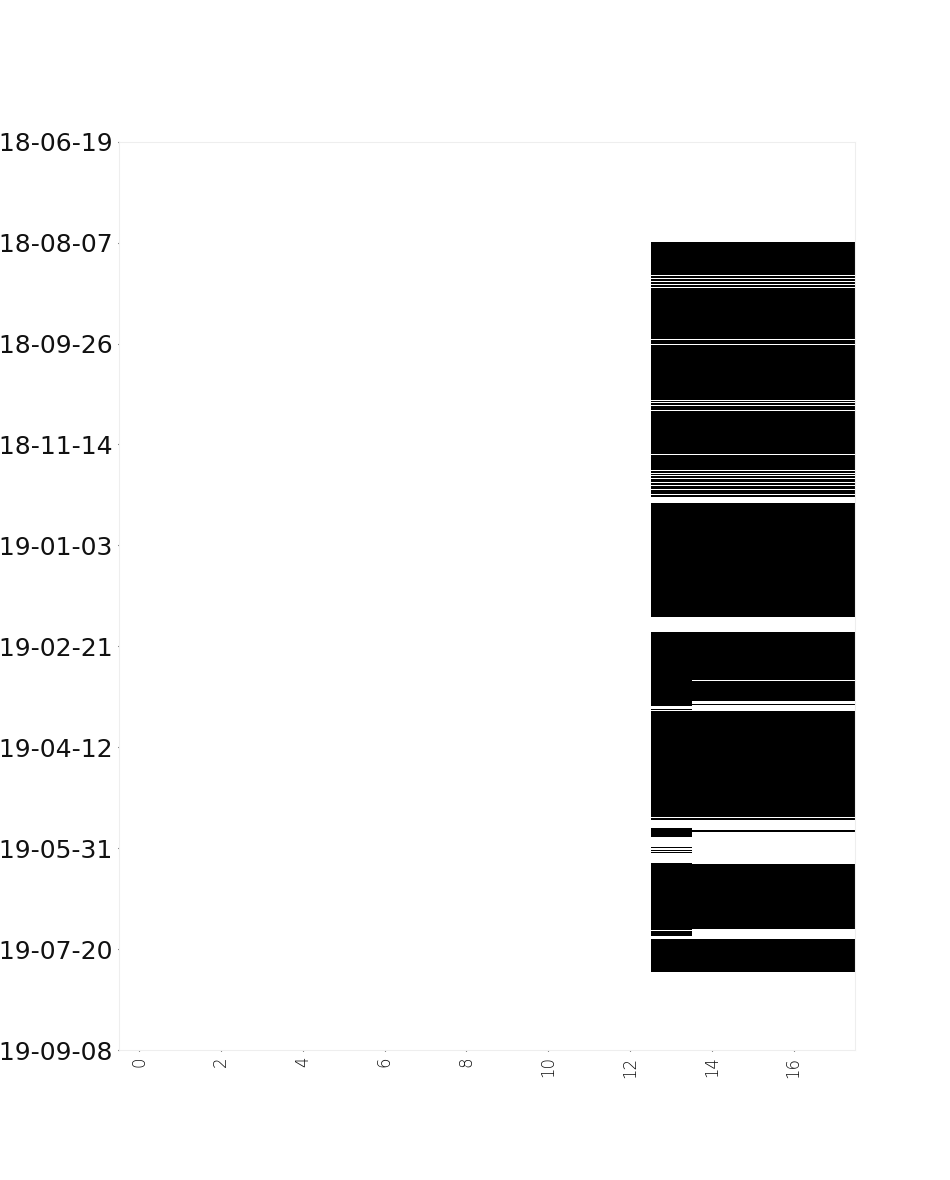
/home/docs/checkouts/readthedocs.org/user_builds/tabulight/checkouts/latest/tabulight/_main.py:347: UserWarning: set_ticklabels() should only be used with a fixed number of ticks, i.e. after set_ticks() or using a FixedLocator.
  im.axes.set_xticklabels(

<Figure size 950x1180 with 1 Axes>
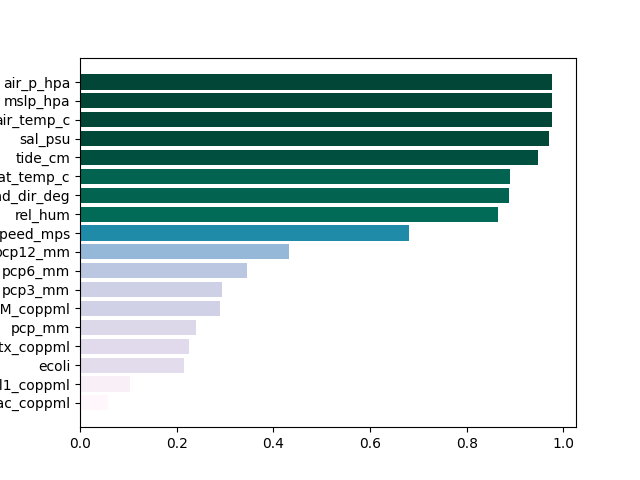
_ = eda.plot_missing()
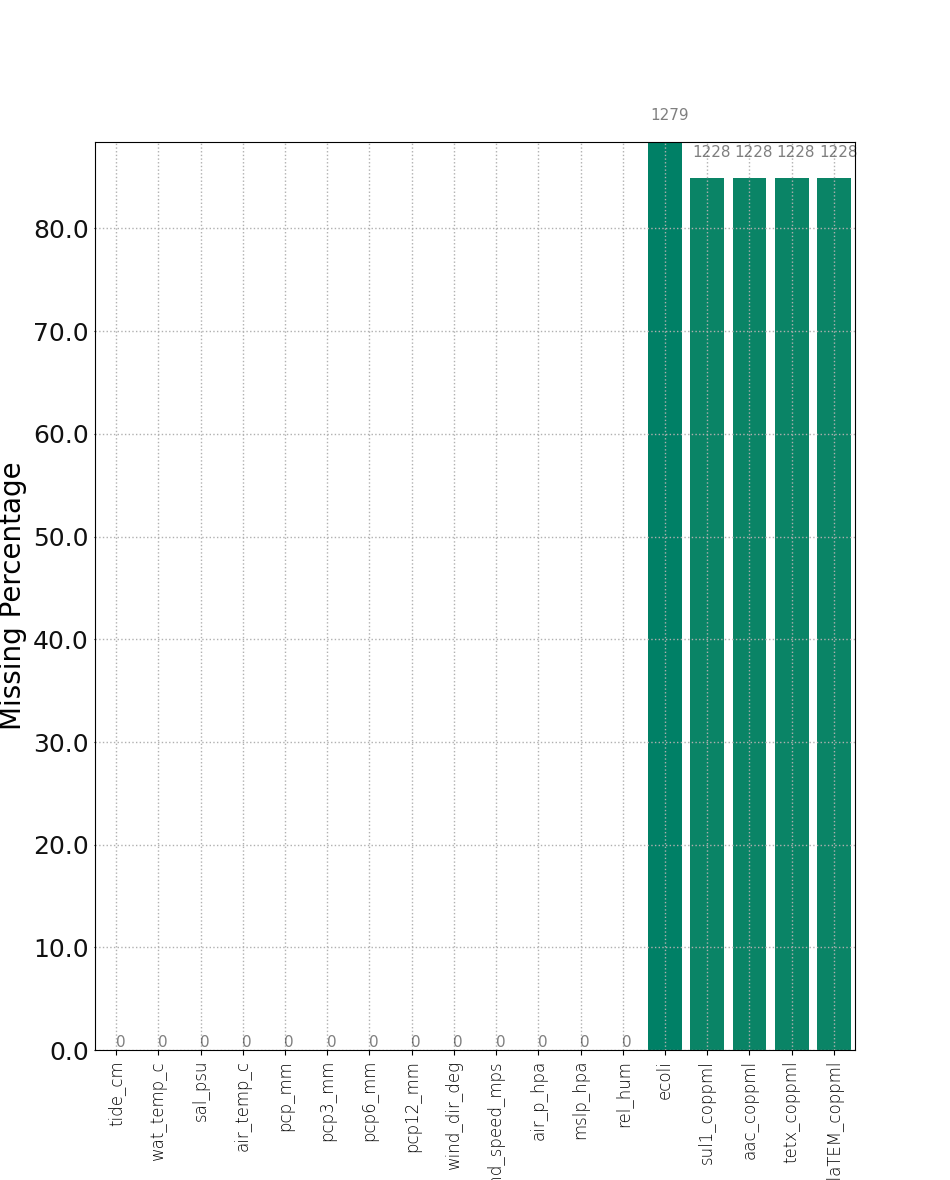
/home/docs/checkouts/readthedocs.org/user_builds/tabulight/checkouts/latest/tabulight/_main.py:444: UserWarning: set_ticklabels() should only be used with a fixed number of ticks, i.e. after set_ticks() or using a FixedLocator.
  ax1.set_yticklabels(ax1.get_yticks(), fontsize="18")
# _ = eda.plot_data(subplots=True, max_cols_in_plot=20, figsize=(14, 20))
#
# ###########################################################
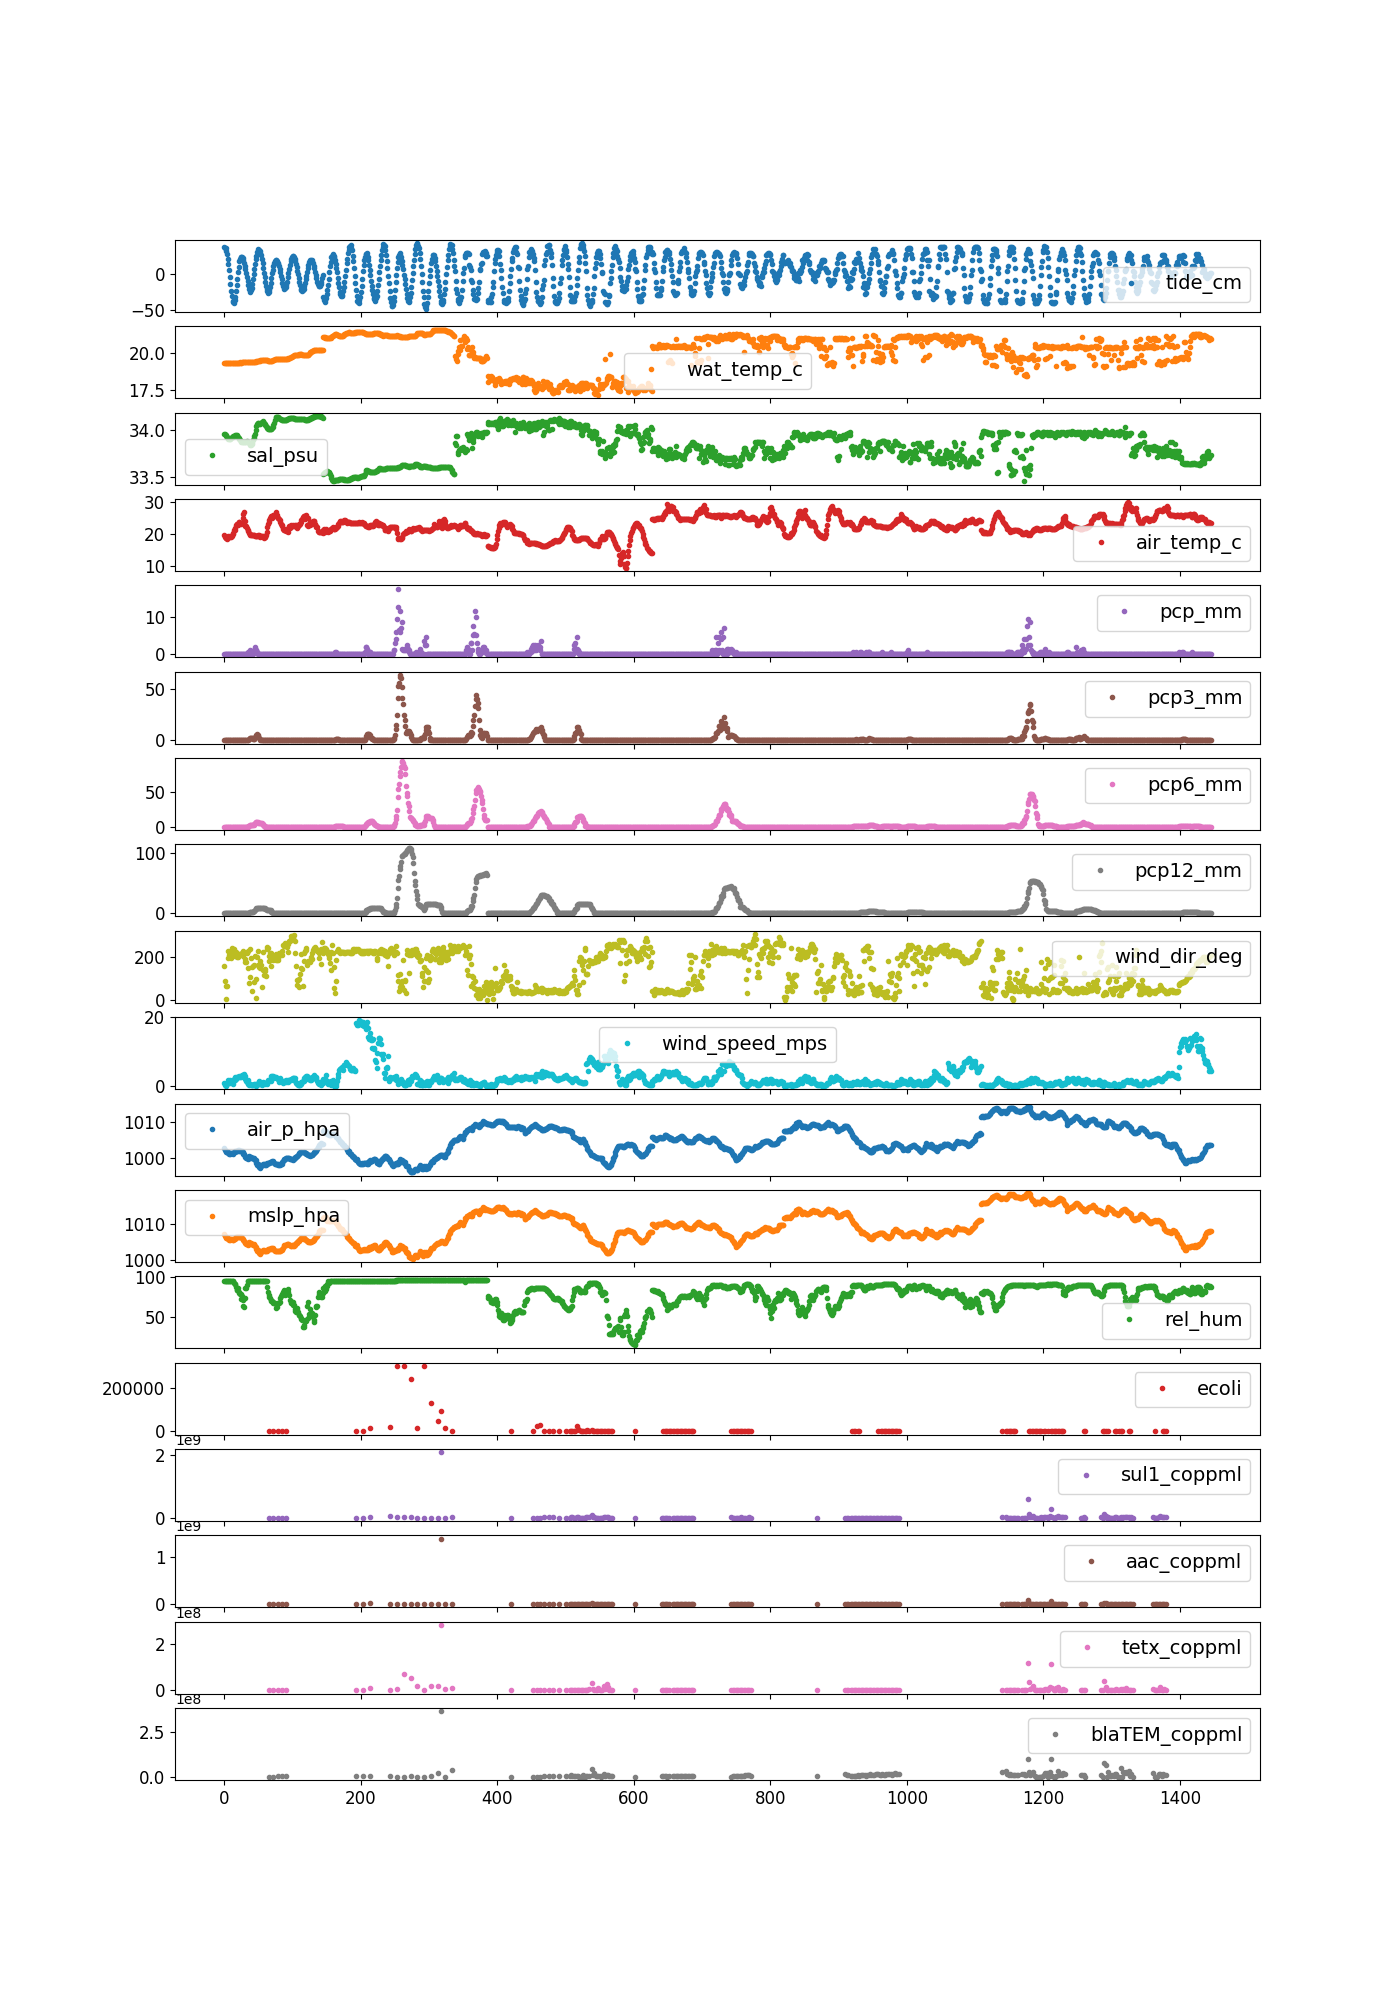
_ = eda.plot_data(subplots=True, max_cols_in_plot=20, figsize=(14, 20),
ignore_datetime_index=True)
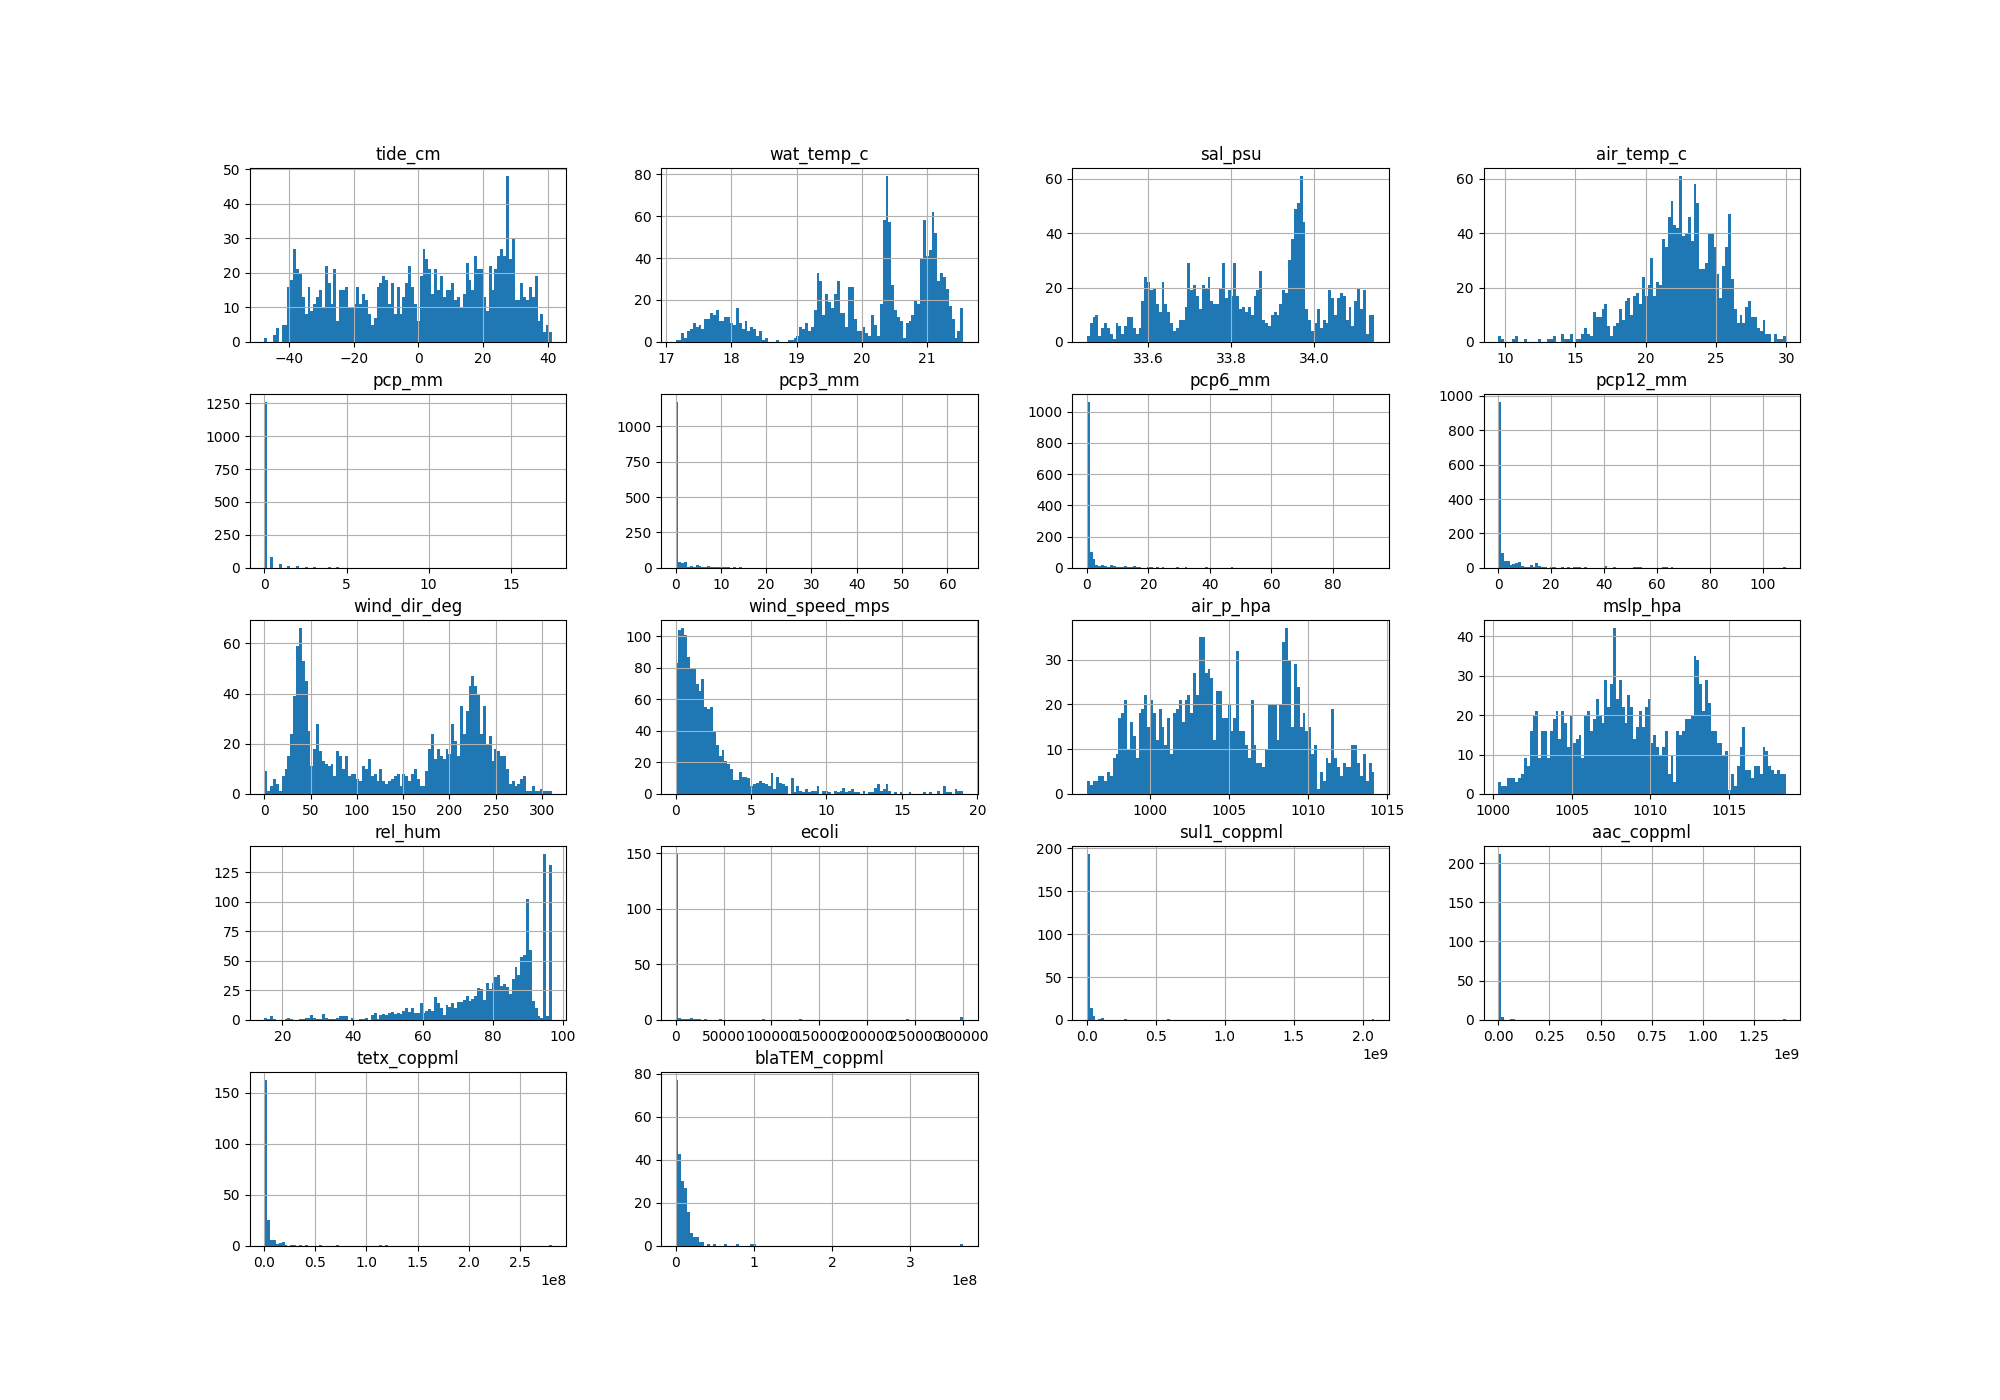
_ = eda.plot_histograms()
_ = eda.box_plot(max_features=18, palette="Set3")
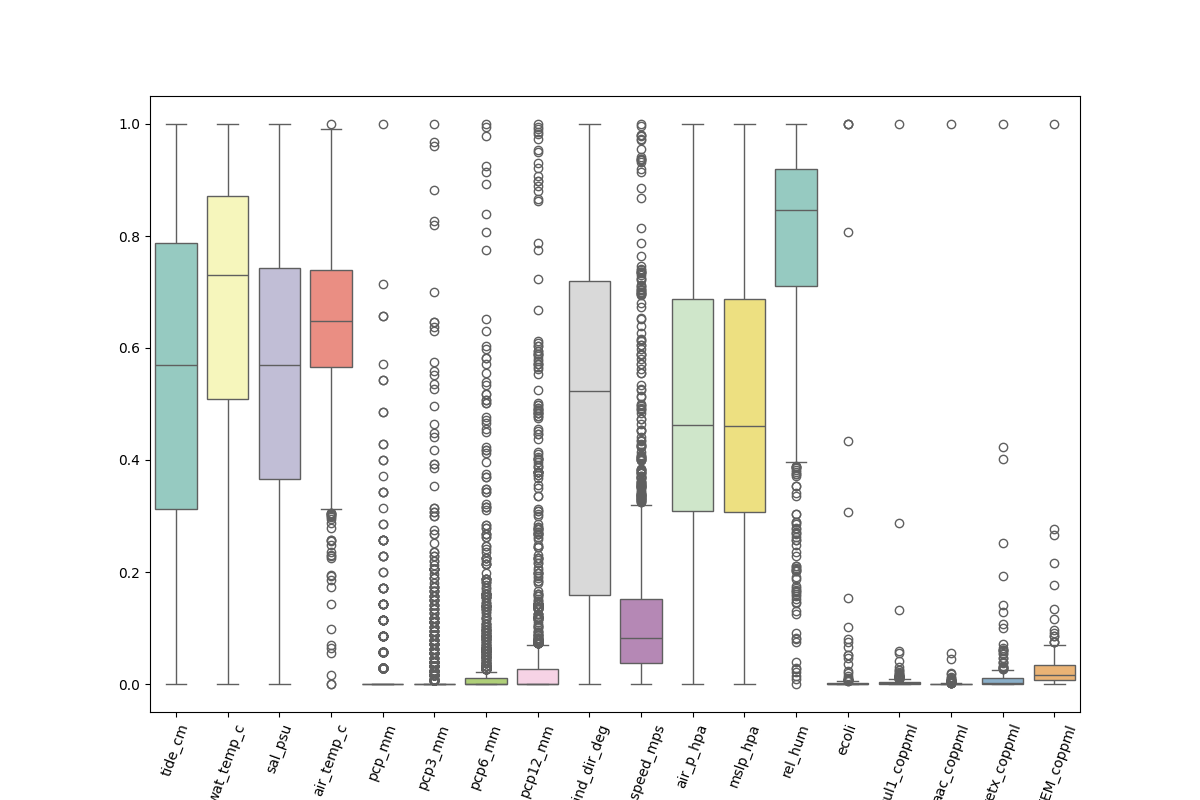
/home/docs/checkouts/readthedocs.org/user_builds/tabulight/checkouts/latest/tabulight/_main.py:1424: UserWarning: set_ticklabels() should only be used with a fixed number of ticks, i.e. after set_ticks() or using a FixedLocator.
  axis.set_xticklabels(list(data.columns), fontdict={'rotation': 70})
eda.box_plot(max_features=18, palette="Set3", violen=True)
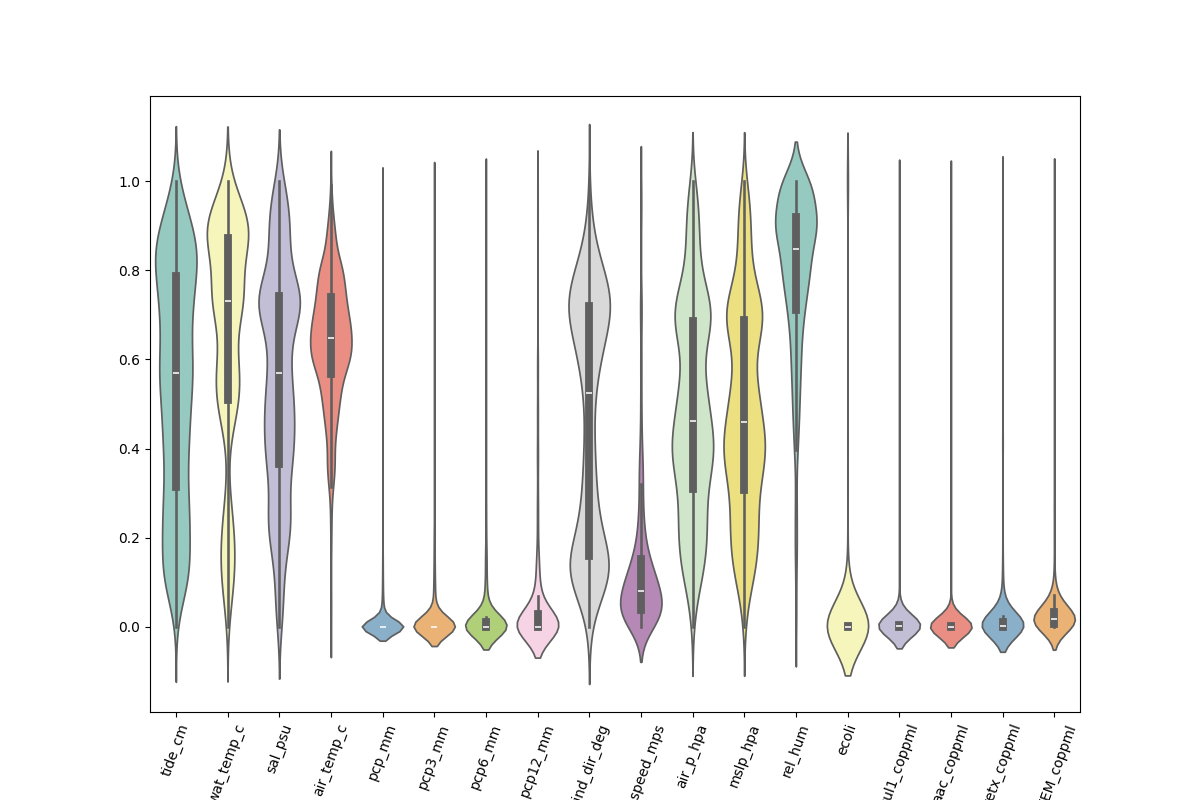
/home/docs/checkouts/readthedocs.org/user_builds/tabulight/checkouts/latest/tabulight/_main.py:1424: UserWarning: set_ticklabels() should only be used with a fixed number of ticks, i.e. after set_ticks() or using a FixedLocator.
  axis.set_xticklabels(list(data.columns), fontdict={'rotation': 70})

<Axes: >
eda.correlation(figsize=(14, 14))

# ###########################################################
#
#
# eda.grouped_scatter(max_subplots=18)
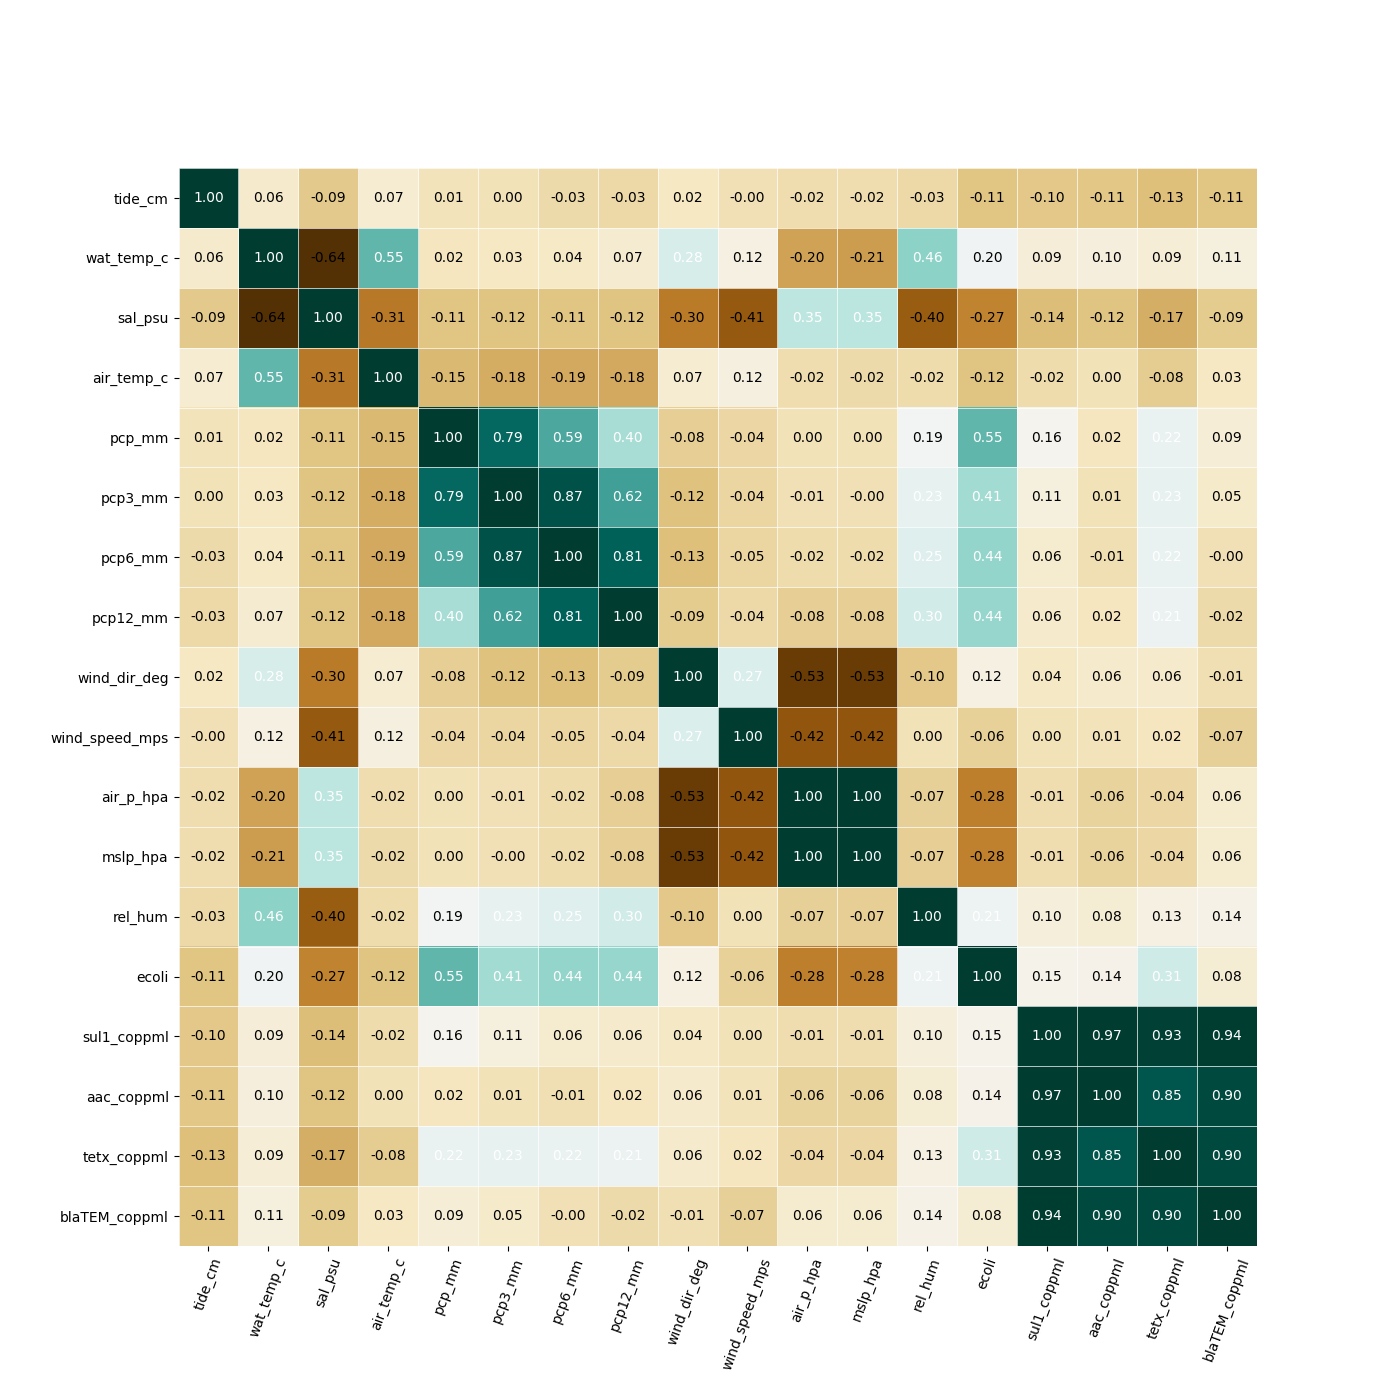
<Axes: >
_ = eda.autocorrelation(n_lags=15)
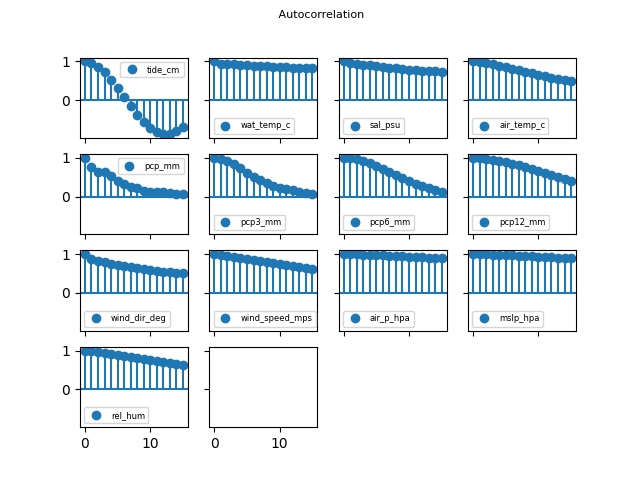
cannot plot autocorrelation for ecoli feature
cannot plot autocorrelation for sul1_coppml feature
cannot plot autocorrelation for aac_coppml feature
_ = eda.partial_autocorrelation(n_lags=15)
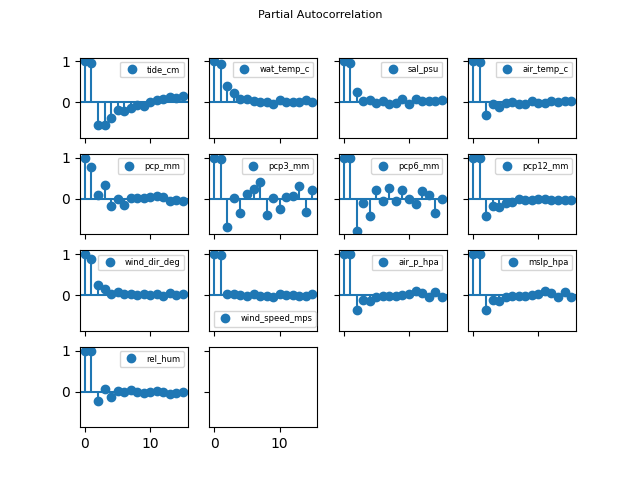
cannot plot autocorrelation for ecoli feature
cannot plot autocorrelation for sul1_coppml feature
cannot plot autocorrelation for aac_coppml feature
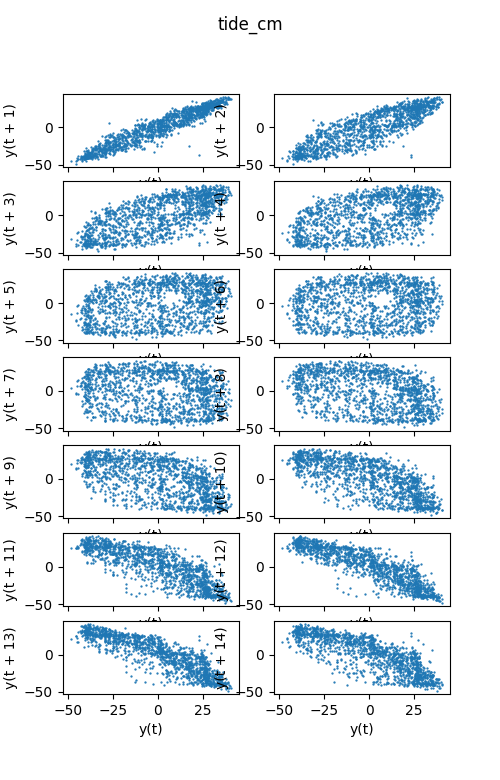
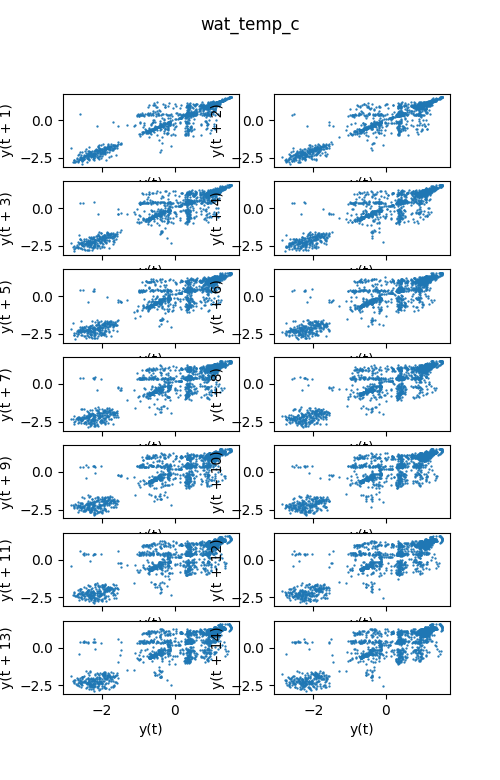
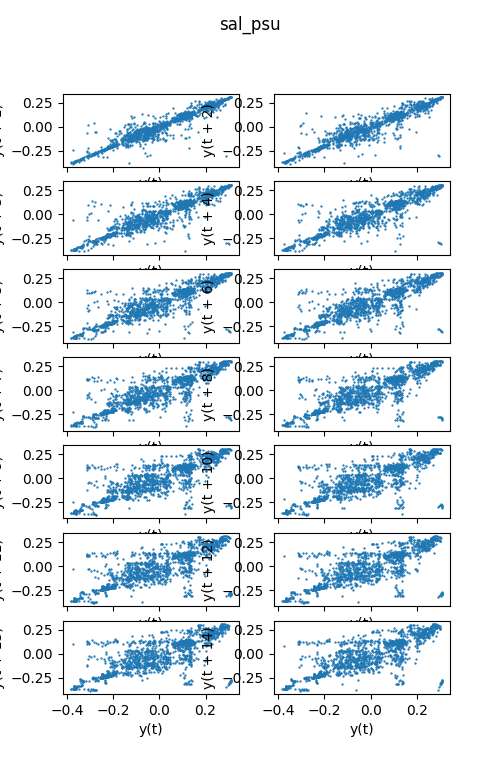
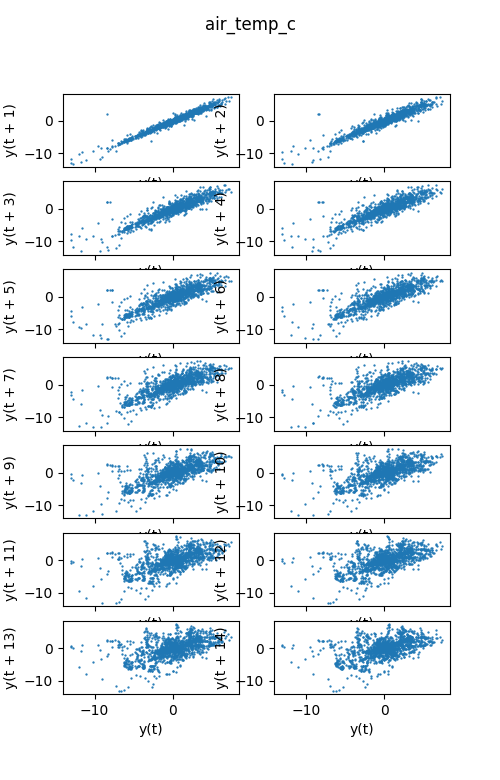
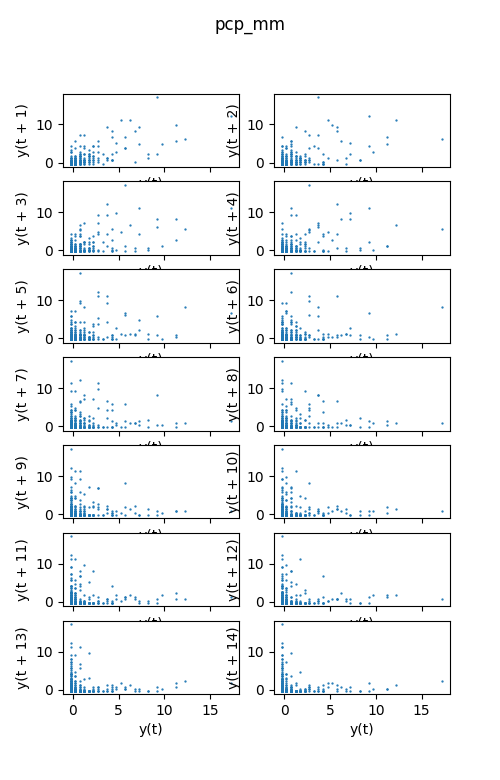
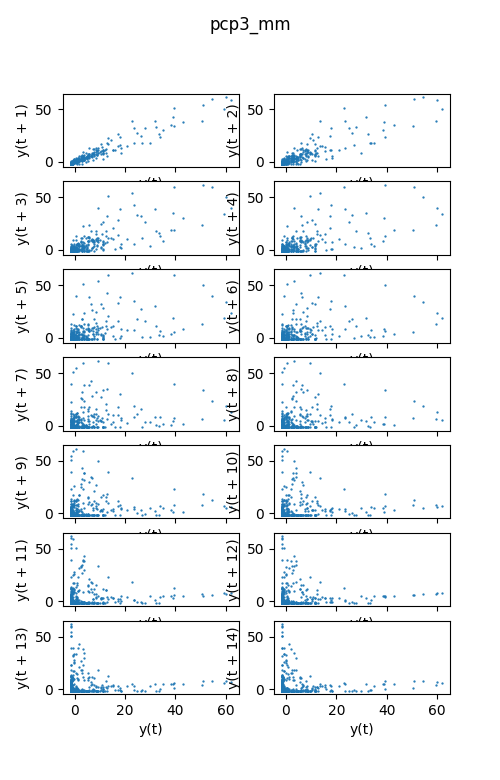
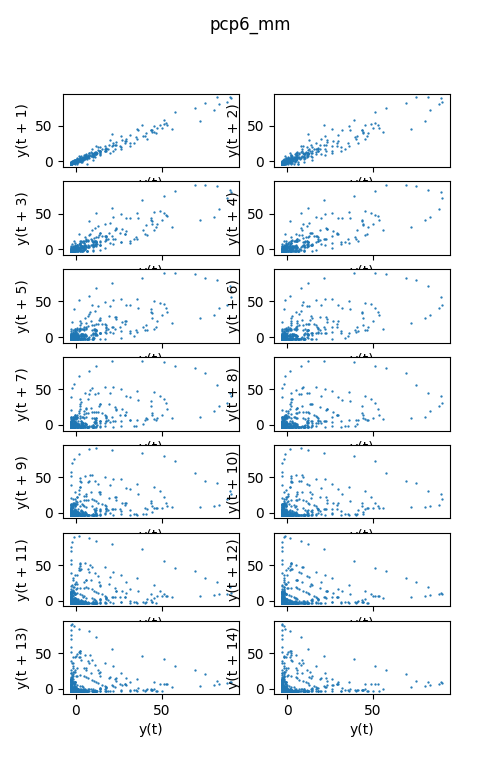
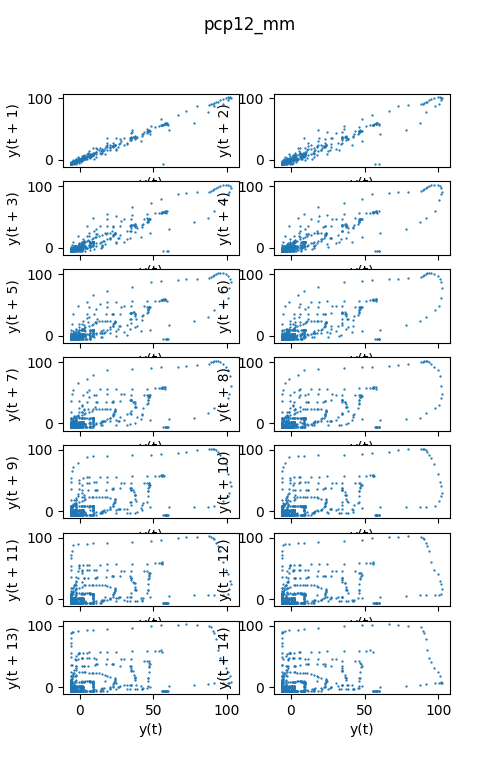
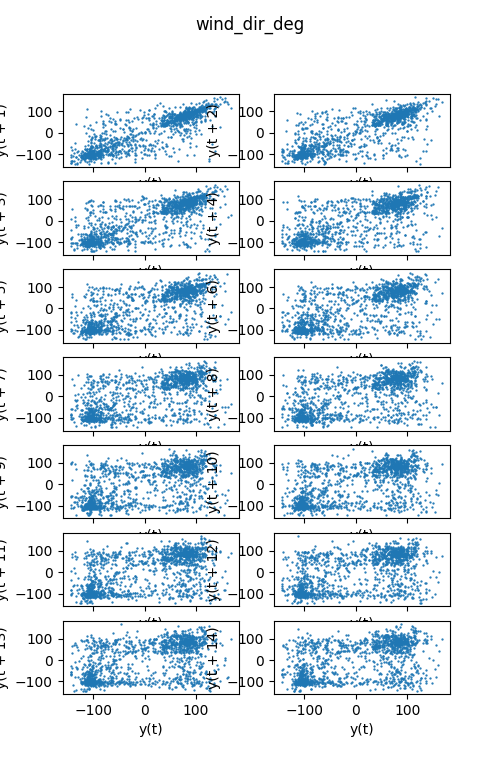
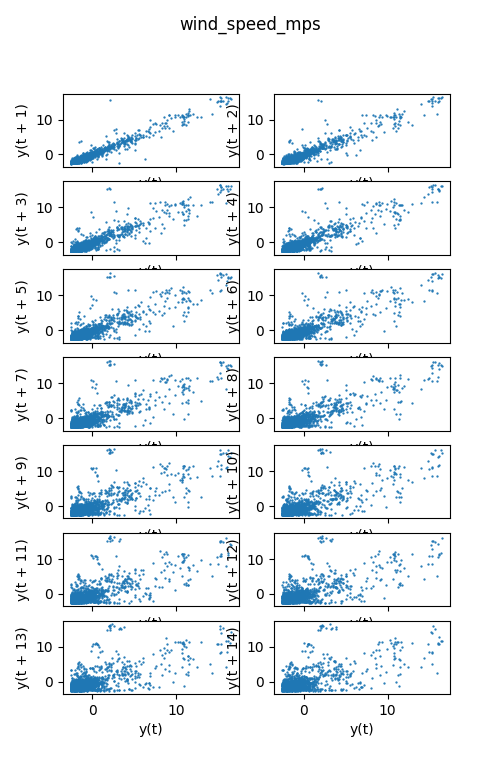
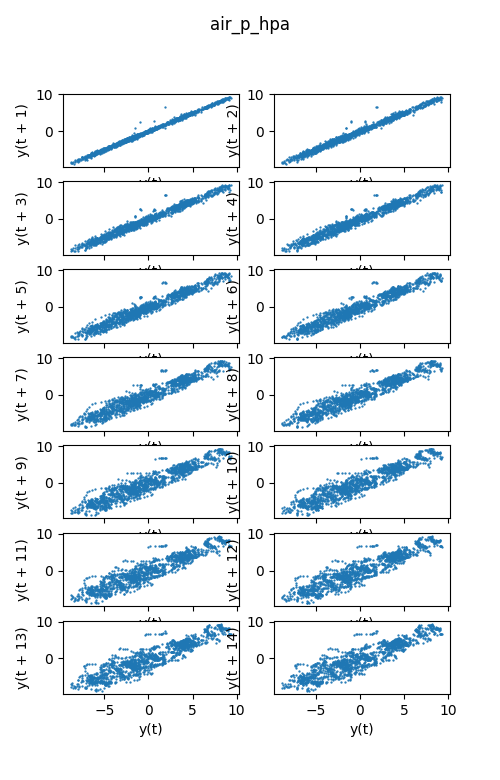
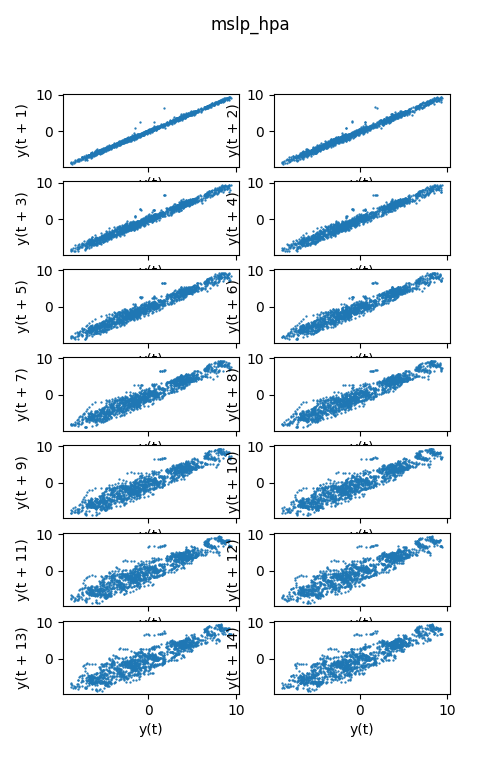
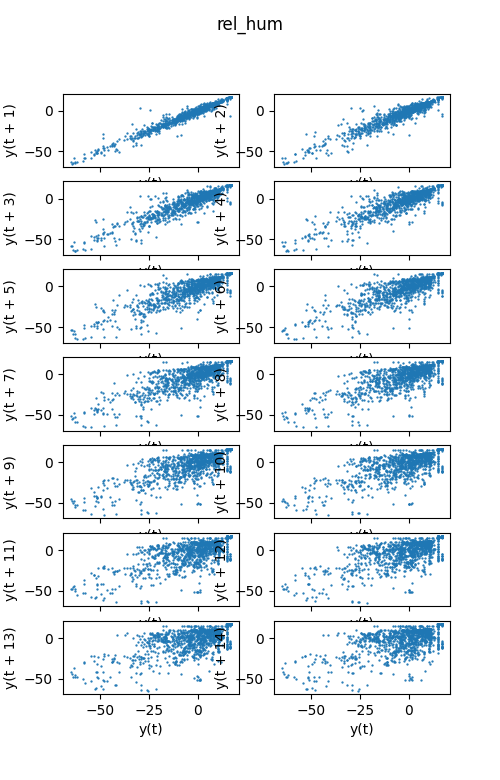
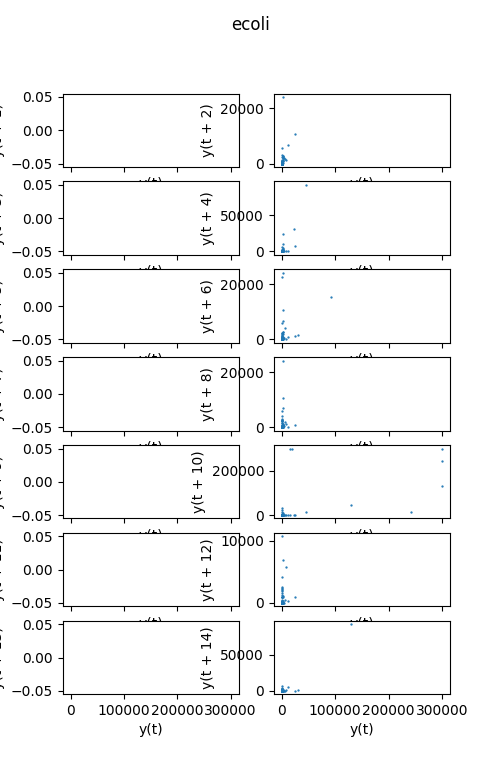
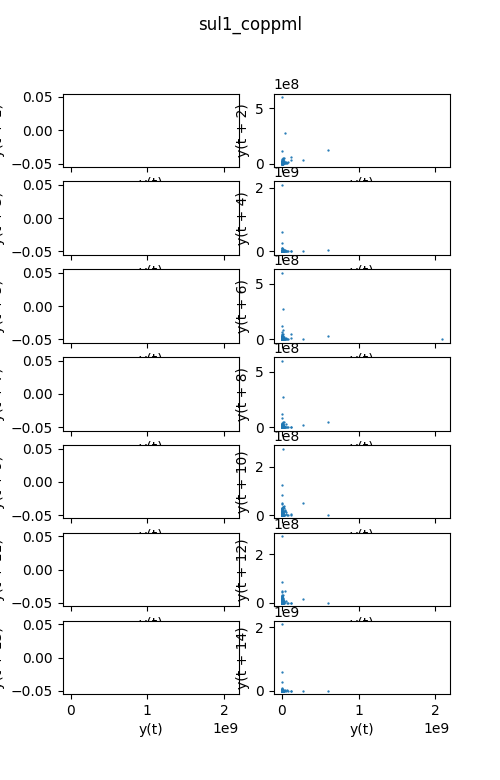
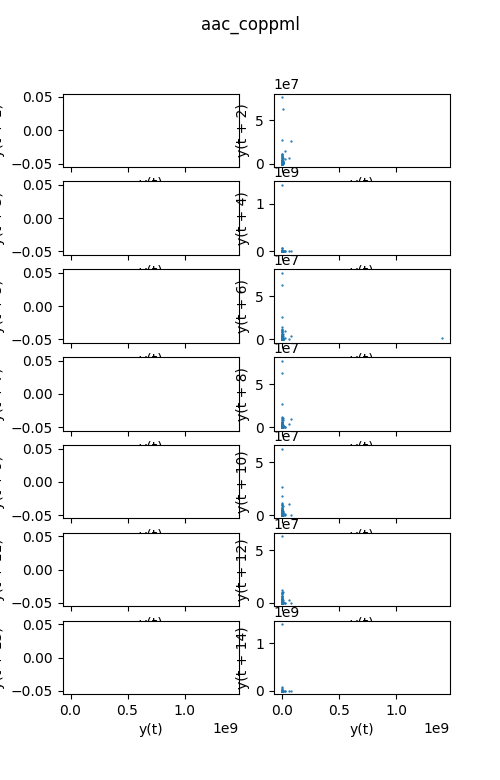
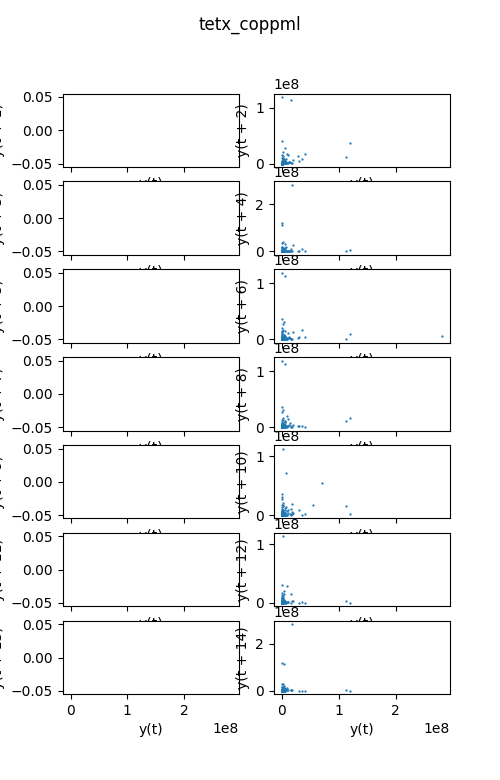
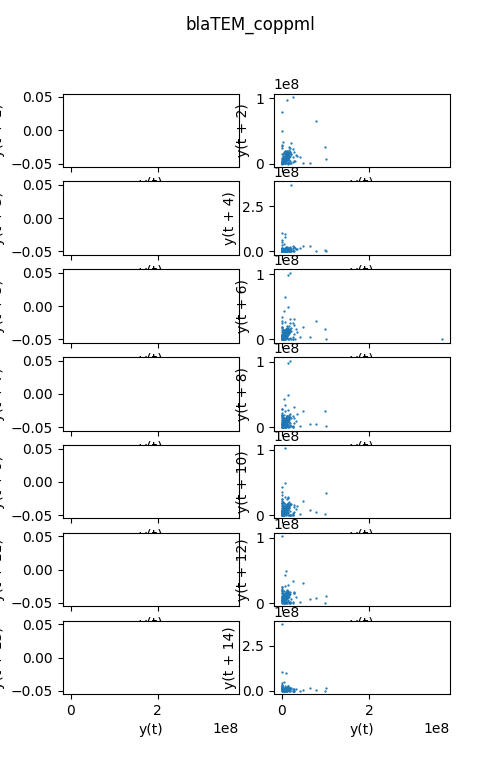
_ = eda.lag_plot(n_lags=14, s=0.4)
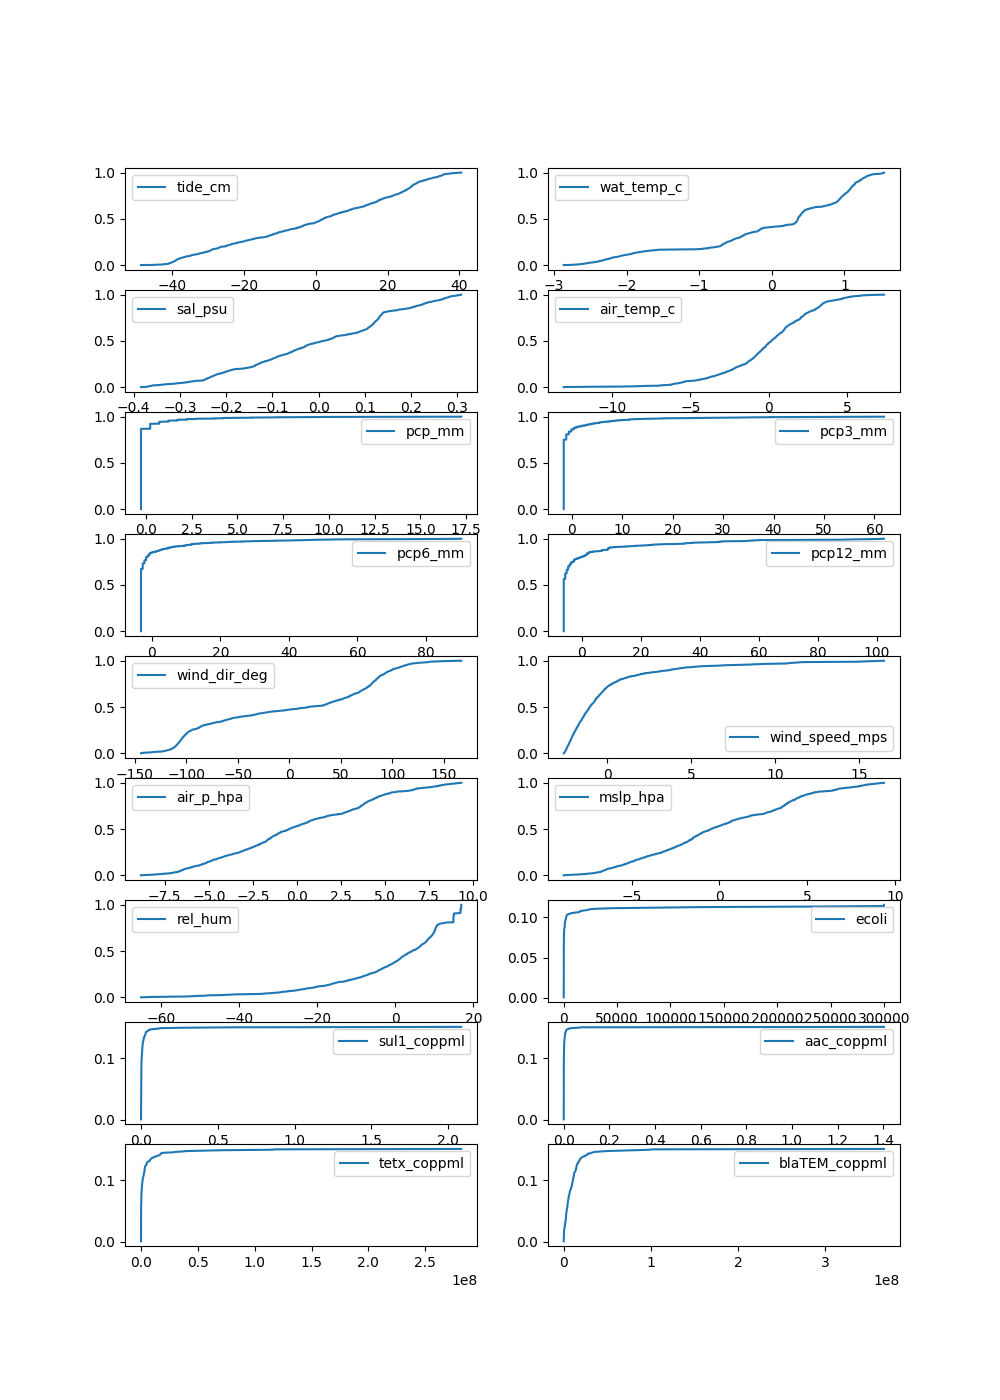
_ = eda.plot_ecdf(figsize=(10, 14))
eda.normality_test()
Total running time of the script: (0 minutes 25.167 seconds)